
Testing Equipments Supplier
ISO9001: 2015 Certified
Views: 4 Author: Site Editor Publish Time: 2026-08-25 Origin: Site


Aging infrastructure maintenance costs are escalating rapidly across the globe. Relying solely on visual surface inspections or localized destructive testing leaves massive blind spots in asset management. Pavement engineers and departments of transportation face a persistent challenge. They need continuous, accurate subsurface data to forecast rehabilitation needs. They must acquire this data without causing severe traffic disruptions or degrading the pavement structure further.
ground penetrating radar serves as the industry-standard non-destructive testing solution. It transitions pavement management from reactive patching to proactive, data-driven lifecycle management. By deploying electromagnetic waves to map subsurface conditions, engineers can pinpoint hidden defects before they manifest as surface failures. This approach fundamentally changes how agencies allocate maintenance funds and plan rehabilitation projects.
Primary Utility: GPR for pavement inspection delivers continuous, high-speed profiling of asphalt and concrete layer thickness, significantly reducing the need for destructive coring.
Defect Detection: The technology reliably identifies subsurface anomalies, including stripping, debonding, delamination, voids, and moisture accumulation before surface failures occur.
Comprehensive Assessment: Beyond surface layers, GPR evaluates base and subgrade structural characteristics and locates buried utilities, ensuring safe and optimized rehabilitation planning.
Operational Trade-offs: While GPR provides extensive spatial coverage, data accuracy is highly dependent on antenna frequency selection, dielectric material properties, and expert data interpretation.
Implementation Reality: GPR does not eliminate coring entirely; it optimizes core placement for ground-truthing, maximizing the ROI of geotechnical investigations.
Table of Contents
A successful pavement evaluation hinges on specific performance metrics. Engineers require continuous data coverage to understand the full scope of a roadway section. Visual surveys only reveal surface distress like alligator cracking or rutting. They fail to show the underlying causes. Minimal traffic disruption is essential to maintain safety and traffic flow on busy interstates. The evaluation must deliver high depth-to-resolution accuracy to differentiate between thin pavement lifts. Finally, the results must be repeatable. Consistent data allows agencies to track pavement deterioration accurately over multiple years and adjust their maintenance schedules accordingly.
Traditional core sampling is inherently destructive and highly localized. Extracting a physical core damages the pavement and provides data for only a few square inches of the roadway. Relying on cores spaced miles apart presents a massive statistical inadequacy. Roadway structures vary significantly between these sample points due to construction inconsistencies or localized subgrade settlement.
Continuous electromagnetic wave profiling captures a complete cross-sectional view. It fills the massive data gaps left by isolated physical sampling. While coring provides absolute ground truth at a single point, radar provides the spatial distribution of layer thicknesses and defects across the entire alignment.
Feature | Traditional Coring | Ground Penetrating Radar (GPR) |
|---|---|---|
Data Coverage | Isolated points (typically 1 per mile) | 100% continuous profiling |
Traffic Impact | Requires lane closures and flaggers | Highway speeds (up to 60 mph) |
Pavement Damage | Destructive (requires patching) | Completely non-destructive |
Primary Use Case | Material testing and calibration | Network-level thickness and defect mapping |
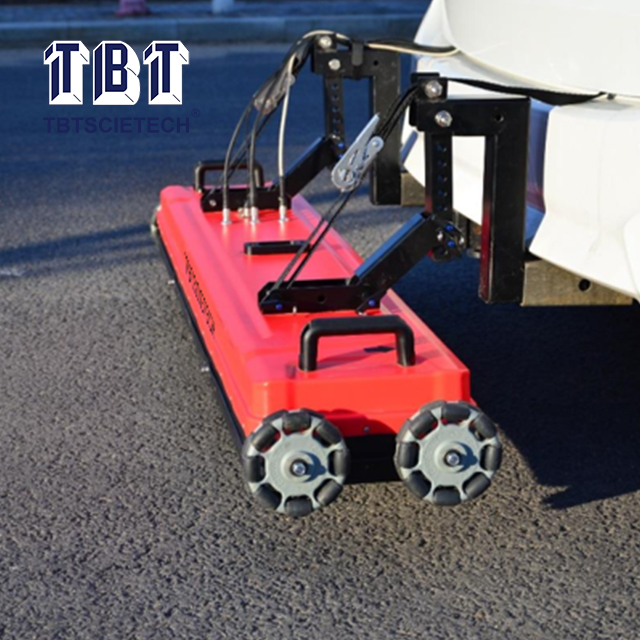
Agencies deploy radar technology differently based on their immediate objectives. Network-level analysis involves high-speed surveys covering hundreds or thousands of lane miles. These surveys support general asset management and create comprehensive thickness maps. Equipment for network-level surveys typically utilizes air-coupled horn antennas mounted to a vehicle bumper, allowing data collection at highway speeds.
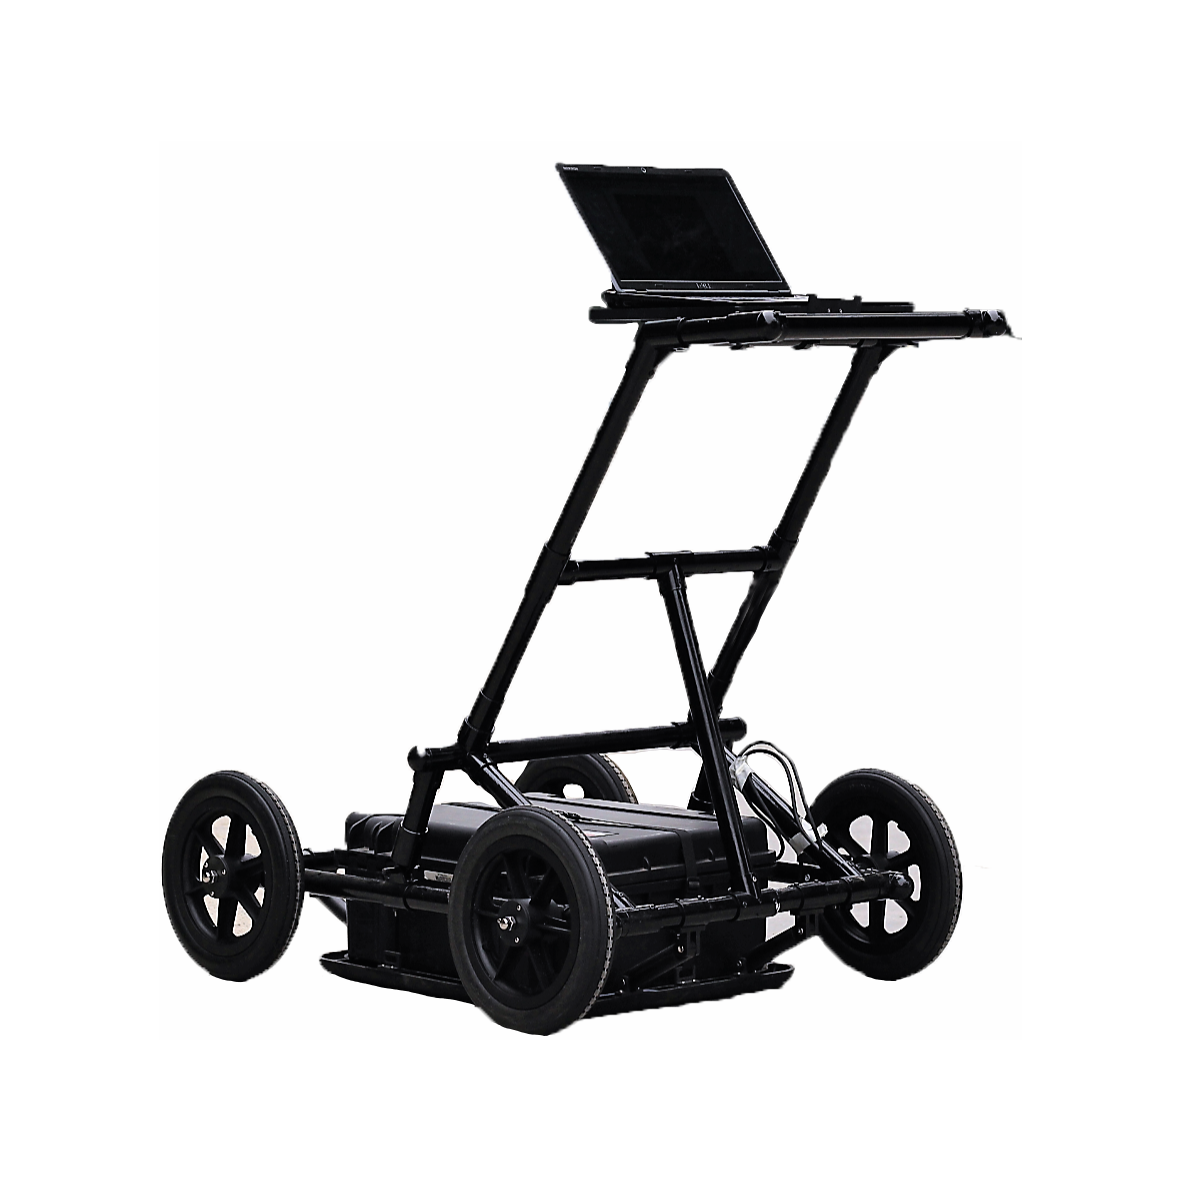
Project-level analysis demands slow-speed, high-resolution forensic investigations. Engineers use this approach to diagnose specific failing road segments before a rehabilitation project begins. The data density required dictates the survey speed and equipment configuration. Project-level surveys often utilize ground-coupled antennas dragged directly across the pavement surface at walking speeds to maximize signal penetration and resolution.
The technology relies on the transmission of high-frequency electromagnetic pulses into the ground. As these pulses travel downward, they encounter different materials. Each material possesses a unique dielectric constant, which dictates how fast the radar wave travels through it. The radar measures the two-way travel time (TWTT) of the reflection caused by changes in these dielectric constants.
A transition from asphalt to a granular base course creates a distinct reflection. Similarly, a transition from dry material to trapped moisture generates a massive signal return. The timing and amplitude of these reflections form the subsurface profile, known as a radargram or B-scan.
Material | Typical Dielectric Constant | Radar Wave Velocity (in/ns) |
|---|---|---|
Air | 1 | 11.8 |
Asphalt | 4 - 6 | 4.8 - 5.9 |
Concrete (Cured) | 6 - 9 | 3.9 - 4.8 |
Granular Base | 6 - 8 | 4.2 - 4.8 |
Water | 81 | 1.3 |
Accurate thickness measurement is the most common application for this technology. Engineers calculate the thickness of asphalt surface courses, base materials, and subgrade layers continuously. The radar records the time it takes for a signal to bounce back from a layer interface. When calibrated with the material's dielectric constant, this time translates directly into physical depth.
Continuous thickness data feeds directly into structural capacity calculations. It also drives precise milling depth planning. Knowing the exact thickness of the asphalt layer prevents milling machines from cutting into the aggregate base course. If a contractor mills into the base, they ruin the cutting teeth on their equipment and compromise the road foundation. This precision protects equipment and ensures a stable foundation for the new overlay.
Roadway longevity depends heavily on the underlying support structure. Radar effectively maps the boundary between the base and subgrade. It identifies areas of localized settlement or severe soil variations. Loss of structural support at the subgrade level inevitably leads to surface distress, regardless of how thick the asphalt layer is.
Mapping these variations allows engineers to target deep repairs rather than applying superficial surface patches. If the subgrade is failing, a simple mill-and-fill operation will fail within a year. Radar data directs crews to perform full-depth reclamation or subgrade stabilization exactly where it is needed.
Pavement layers must act as a cohesive unit to distribute traffic loads. Radar identifies areas where asphalt layers have separated, known as debonding or delamination. It also detects stripping, which is the degradation of the asphalt binder. When stripping occurs, the aggregate loses its binding agent, turning the asphalt layer back into loose gravel.
These defects present a distinct signature in radargrams. Engineers look for strong reflection amplitudes between layers that should otherwise be bonded. A sudden spike in signal reflection at an asphalt interface often indicates moisture intrusion or complete layer separation. Phase inversion in the radar signal is a classic indicator of a lower-density material (like a stripped layer) sitting beneath a higher-density material.
Water is the primary enemy of pavement structures. There is a massive dielectric contrast between pavement materials and water. Asphalt has a low dielectric constant (around 5), while water has a very high one (81). This stark contrast makes moisture detection highly reliable.
Radar maps trapped moisture and subgrade washouts with precision. These washouts create subsurface voids. If left unaddressed, these voids lead to sudden sinkholes or accelerated fatigue cracking. Early detection allows maintenance crews to inject polyurethane grout or stabilize the subgrade before catastrophic failure occurs.
Concrete pavements require precise reinforcement placement to function correctly. Engineers use radar in continuously reinforced concrete pavements (CRCP) and jointed plain concrete pavements (JPCP). The technology verifies rebar depth and spacing across the entire slab to ensure compliance with design specifications.
Dowel bar alignment is critical for load transfer between concrete joints. Misaligned dowels cause joint lockup, preventing the concrete from expanding and contracting with temperature changes. This lockup leads to severe spalling and cracking. Radar scans provide a clear, non-destructive method to verify that dowel baskets remained perfectly aligned during the concrete paving process.
Bridge decks represent a specialized subset of pavement inspection. Engineers evaluate concrete bridge decks for rebar corrosion and concrete deterioration using standardized methods like ASTM D6087. The radar detects the attenuation of the signal reflecting off the top mat of reinforcing steel.
When chlorides from de-icing salts penetrate the concrete, they cause the rebar to corrode and expand. This expansion creates micro-cracking and internal delamination. The radar signal scatters when it hits these deteriorated areas, resulting in a weaker reflection. The resulting amplitude maps show exactly which sections of the deck require hydro-demolition or full-depth patching.
Striking a buried utility during roadwork causes severe safety hazards, project delays, and massive liability. Radar plays a critical role in identifying buried pipes, conduits, and cables. Crews scan the area prior to pavement rehabilitation, trenching, or full-depth reclamation.
Using gpr for pavement inspection ensures that heavy reclamation machinery does not destroy shallow utilities. It provides a reliable subsurface map that protects both the infrastructure and the construction personnel. Unlike electromagnetic wand locators, radar can detect non-metallic utilities like PVC pipes and fiber optic lines.
Selecting the correct antenna frequency determines the success of the survey. Higher frequencies provide better resolution but lack penetration depth. Lower frequencies penetrate deeper but cannot resolve thin layers. Engineers must use a strict decision framework for selecting antenna frequencies based on project goals.
High-frequency antennas, ranging from 1.0 GHz to 3.0 GHz, excel at high-resolution, shallow asphalt inspection. They easily measure thin surface lifts and detect shallow delamination. Lower-frequency antennas, operating between 400 MHz and 900 MHz, are necessary for deeper base, subgrade, and utility evaluation. Many modern systems deploy dual-frequency antennas to capture both shallow and deep data simultaneously.
Antenna Frequency | Approximate Penetration Depth | Primary Application |
|---|---|---|
2.0 GHz - 3.0 GHz | 0 to 24 inches | Surface lift thickness, bridge decks, shallow rebar |
1.0 GHz | 0 to 36 inches | Total asphalt thickness, base course boundary |
400 MHz - 900 MHz | 3 to 10 feet | Subgrade evaluation, void detection, utility locating |
Radar signals do not perform uniformly across all environments. Highly conductive soils severely limit signal penetration. Heavy clays retain moisture and conduct the electromagnetic signal away from the receiver. This attenuation reduces the effective depth of the survey, sometimes limiting a 400 MHz antenna to just a few feet of penetration.
Environments with high salinity present similar challenges. Coastal roads or areas heavily treated with de-icing salts absorb radar energy rapidly. Additionally, tightly spaced rebar mesh in concrete can act as a shield, preventing the radar signal from penetrating past the top mat of steel. Engineers must account for these material constraints when planning a survey and interpreting the resulting data.
Raw radargrams look like static noise to the untrained eye. They require advanced software processing to become useful. Post-processing involves filtering background noise, applying depth gains to amplify weak signals from deeper layers, and migrating hyperbolic reflections to show the true position of buried objects.
Experienced geophysicists or trained engineers must translate these reflections into actionable engineering reports. Automated software assists in picking layer interfaces, but human expertise remains necessary to validate anomalies and discard false positives. Relying entirely on automated layer-picking algorithms often leads to massive errors if the software misinterprets a moisture pocket as a layer boundary.
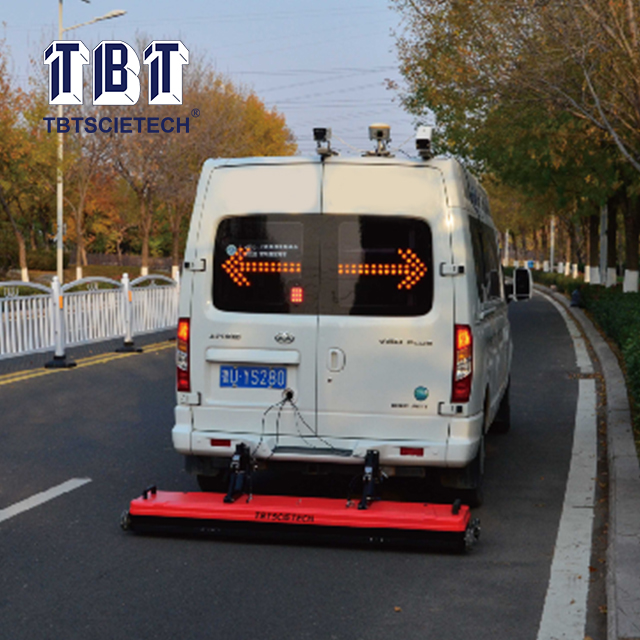
Vehicle-mounted, highway-speed data collection fundamentally changes project economics. Systems can collect continuous data at speeds up to 60 mph. This eliminates the need for rolling lane closures, flaggers, or extensive traffic control setups. Keeping workers out of live traffic lanes drastically improves safety metrics.
Compare this to Falling Weight Deflectometer (FWD) testing or traditional coring. Both require stationary equipment and lane closures. The cost savings associated with keeping traffic moving and avoiding traffic control permits often offset the entire cost of the radar survey.
The upfront cost of comprehensive radar surveys can seem significant. However, the long-term savings are substantial. Accurate thickness data prevents premature pavement failure by ensuring structural designs match reality. If an engineer designs an overlay assuming 6 inches of existing asphalt, but the radar shows only 3 inches, the design will fail prematurely.
Optimizing rehabilitation scopes yields massive material savings. Avoiding over-milling by just half an inch across a ten-mile highway project saves thousands of tons of asphalt. The technology pays for itself by eliminating guesswork from construction estimates and preventing contractor change orders.
Data collection is only valuable if it drives decisions. Processed radar data exports directly into GIS-based Pavement Management Systems. This integration links subsurface conditions to specific GPS coordinates along the roadway. Agencies can view color-coded maps showing asphalt thickness or defect severity overlaid on satellite imagery.
Engineers use this integrated data to calculate the remaining service life (RSL) of the pavement network. It allows agencies to prioritize network-level funding based on actual structural degradation rather than just surface appearance. Roads that look fine on the surface but have severe subgrade issues can be flagged for early intervention.
Radar detects changes in dielectric properties, not specific materials. This creates a risk of misinterpreting buried debris or harmless material variations as critical defects. A buried piece of metal or an old patch might look similar to a severe moisture pocket on a raw scan.
Mitigation requires cross-referencing radar data with surface distress surveys. Engineers must also review historical construction records. If a radargram shows an anomaly but the surface is pristine, further localized investigation is necessary before prescribing repairs. Combining radar data with FWD data provides a much clearer picture of structural integrity.
Radar is an indirect measurement tool. It measures time, not physical depth. To convert time to depth accurately, the system requires the exact dielectric constant of the pavement materials. Without calibration, depth calculations can be off by 10% to 20%.
Mitigation mandates a strict calibration workflow:
Collect the continuous radar data across the project alignment.
Identify representative locations in the software that show clear layer boundaries.
Extract a targeted physical core at those exact GPS coordinates.
Measure the physical thickness of the extracted core with a tape measure.
Input the physical depth back into the software to back-calculate the exact dielectric constant.
Apply this calibrated constant to the rest of the dataset for highly accurate depth reporting.
Not all radar systems deliver the same quality of data. Agencies must evaluate service providers and equipment rigorously. A standard checklist should include multi-channel system capabilities for wider lane coverage, allowing a single vehicle pass to scan the wheel paths and the center of the lane simultaneously.
Evaluate the need for air-coupled versus ground-coupled antennas based on required survey speeds. Demand software transparency so raw data can be audited by third-party engineers if necessary. Finally, ensure all operating personnel hold recognized geophysical or engineering NDT certifications to guarantee data quality.
To implement this technology effectively and transition toward data-driven pavement management, follow these actionable steps:
Initiate a pilot survey on a representative road segment to establish baseline data collection workflows and test vendor capabilities.
Pair the initial scans with targeted physical coring to validate depth accuracy and calibrate local dielectric constants.
Integrate the processed spatial data directly into your existing GIS or pavement management software to visualize subsurface defects.
Scale the deployment to a network-wide level only after internal teams are comfortable interpreting the calibrated reports and applying the data to rehabilitation designs.
For pavement engineers, testing laboratories, contractors, and transportation agencies seeking reliable testing solutions, TBT provides professional testing instruments and equipment for pavement, road, and civil engineering applications. With experience supporting infrastructure testing requirements, TBT can help customers select suitable testing solutions for pavement evaluation, quality control, and data-driven maintenance projects.
A: When properly calibrated with ground-truth cores, the technology measures asphalt thickness with an accuracy of ±3% to 5%. This precision relies on accurately determining the dielectric constant of the specific pavement materials through targeted physical sampling.
A: Yes. The radar detects the precursor conditions that eventually collapse into potholes. It identifies subsurface voids, severe asphalt stripping, and moisture pooling long before the surface layer breaks apart under traffic loads.
A: Penetration depends entirely on antenna frequency and material conductivity. High-frequency antennas penetrate 1 to 3 feet, providing high resolution for surface layers. Lower-frequency antennas can reach 6 to 10 feet deep, making them ideal for subgrade and utility analysis.
A: Yes. Standing water on the pavement surface scatters the radar signal and creates severe surface reflections. This masks underlying layer data. Data collection immediately after heavy rain or snowmelt is highly unadvisable.
A: Radar measures structural dimensions, layer thicknesses, and locates physical defects. FWD measures the structural response and load-bearing capacity of the pavement. They measure different metrics and are best used together for a comprehensive structural evaluation.
A: Air-coupled antennas operate suspended above the road, allowing for highway-speed data collection without traffic disruption. Ground-coupled antennas drag directly on the surface. They offer deeper signal penetration but require significantly slower survey speeds.
